When I first started utilizing AWS RDS, I ran into a slew of issues. Most of them are due to a lack of knowledge, and a few are because they are not straightforward. Audit logs are one of them. I couldn’t find anything even after selecting the option to publish the audit logs to cloud watch. It took some time to figure out how to enable audit logs in Cloudwatch.
If you have a database instance but have not yet published the audit logs for Cloudwatch, follow the instructions below.
Create the “Options” group with “Audit plugin”
- On the Amazon RDS console, choose Option groups.
- Choose “Create option group”.
Screenshot-1: 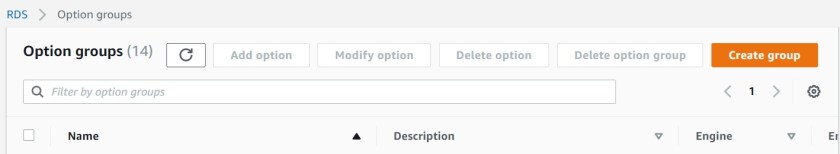
- Enter a name (for example, audit-mysql-8-0).
- Enter a description.
- Choose MySQL or your preferred engine.
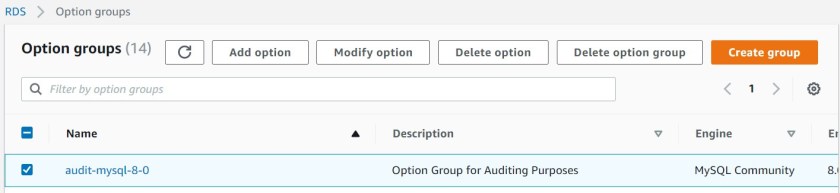
Available engines are as shown in the below screenshot-2)
Screenshot-2:

- Choose your desired engine version (for MySQL, 5.6, 5.7 and 8.0 are available as of now).
- Click on Create.
- Go back to the Option groups page and select the option group you just created. This can be edited or deleted or additional options can be added. Refer to the Screenshot-3.
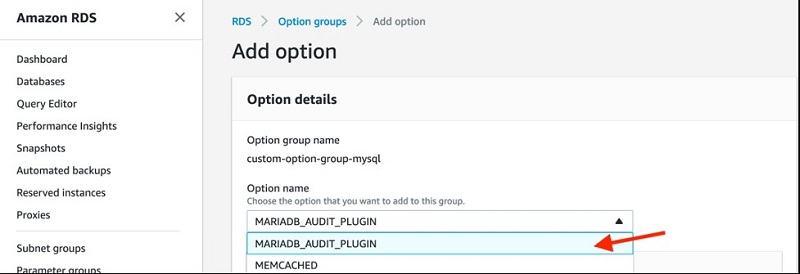
- Click on “Add option”.
- There is a dropdown menu for “Option name”. Select “MariaDB_Audit_Plugin”. This is for MySQL as well.
- It is followed by an Option setting.
SERVER_AUDIT: This setting is enabled for security and ensures that the plugin cannot be uninstalled at runtime. Allowed values are FORCE_PLUS_PERMANENT. SERVER_AUDIT_EVENTS: This is types of actions to be logged (connect, query, or table) Allowed values are – CONNECT, QUERY, QUERY_DDL, QUERY_DML, QUERY_DCL, QUERY_DML_NO_SELECT
SERVER_AUDIT_EXCL_USERS: This is to exclude specified users, by default NULL
SERVER_AUDIT_FILE_PATH: This is for file location for logs – By default – /rdsdbdata/log/audit/
SERVER_AUDIT_FILE_ROTATE_SIZE: The default range of values allowed is 1-1000000000 - Once you fill the required information, you can proceed to apply the changes to the Option-Group. It can be applied immediately or during a next reboot.

- Now, go back to the RDS dashboard, Select the DB instance that you want to use to export log data to CloudWatch.
- Choose Modify.
- Go to “Additional configuration” section in which the options can be changed such as Database options, backup turned on, Performance Insights turned on, Enhanced Monitoring turned off, maintenance, CloudWatch Logs, delete protection turned off.
- Change the Option group to the one you created. As per the example it is – audit-mysql-8-0.

Publish audit logs to CloudWatch
- From the Log exports section, select Audit log.
- Choose Continue.
- Review the Summary of modifications, and choose Modify instance.

- Continue is located at the bottom of the page, click on it. Examine the summary. Choose whether to make the changes immediately or after a maintenance reboot.
That’s it.
Even if you select the audit-logs option in the instance’s Log exports, the audit logs will not be published until your option group has the audit-plugin enabled, as mentioned in this article.
Hope you find this article helpful.
Happy learning!!
